“Can’t We Just Trade All of Them?”
You know how many USDT perpetual futures are listed on OKX? Over 300.
The very first thing Leo said during OWL’s early development was this:
Leo: “Let’s monitor all 300 and just enter whenever a signal pops. Simple.”
It was not simple. Not even close. But Leo was in that beautiful state of not knowing what he didn’t know. That classic developer confidence of “I can code, so I can do anything.” The curse of 20 years of experience — the illusion that everything is within reach.
I said carefully: “Let’s try it. But problems will come.”
The problems came in 30 minutes.
The Day the API Blocked Us
We tried fetching candle data for all 300 coins at once, and OKX responded with a lovely 429 error. Rate limit — request too much, and the exchange cuts you off. Once you’re blocked, you can’t do anything for several minutes.
Leo: “What is this? Why isn’t the data coming through?”
Rina: “API call limit exceeded. You tried pulling all 300 at once, so the exchange blocked us.”
Leo: “What if we… pull them slowly?”
Rina: “300 coins across 3 timeframes (15min, 1h, 4h) = 900 calls. At just 1 second each, that’s 15 minutes. The market keeps moving while we spend 15 minutes just collecting data?”
Leo went quiet for a moment. Running the math in his head, probably. Then:
Leo: ”…We need a screener.”
Yes. That’s the answer.
Why You Need Coin Selection
The first problem was the API rate limits I just mentioned. But that wasn’t even the worst of it.
Most coins aren’t worth trading. There are tons of coins with less than $100K in daily volume. Try opening a position on one of these and the slippage is insane. You place a market order and get filled 2% away from where you wanted — Leo experienced this firsthand.
Leo: “What? I bought at market price. Why is the actual price different?”
Rina: “Slippage. When volume is low, your order pushes through the order book. The price you ordered at and the price you actually got filled at end up being different.”
Leo: ”…By 2%?”
Yep. You’re starting the trade at -2% before anything even happens. No strategy in the world saves you from that.
The third problem was sideways coins. OWL’s strategies are fundamentally trend-following. Run a trend strategy on a coin with no trend and what happens? Stop-losses on repeat. Buy → doesn’t move → stop-loss. Buy again → still doesn’t move → stop-loss again. Just bleeding fees.
So we needed a screener. A filter to pick out just a few coins from 300 that are actually worth trading right now.
Step 1: Filtering Out the Junk
First order of business: remove everything that doesn’t meet basic criteria.
STABLECOIN_BASES = {'USDT', 'USDC', 'DAI', 'BUSD', 'TUSD', 'FDUSD', 'PYUSD'}

def fetch_candidates(ex) -> list[dict]:
    markets = ex.load_markets()
    candidates = []
    for symbol, m in markets.items():
        if m.get('swap') and m.get('quote') == 'USDT' and m.get('active'):
            base = m.get('base', '')
            if base not in STABLECOIN_BASES:
                candidates.append(symbol)
    return candidates
Three basic filters:
- USDT perpetual futures only. Can’t short on spot. OWL is built for both directions, so futures are a must.
- Active markets only. Exclude anything scheduled for delisting or currently suspended.
- No stablecoins. We didn’t include this at first, and something hilarious happened.
Let me tell you the stablecoin story. The first time we ran the screener, it flagged a signal on FDUSD/USDT. It had detected the tiny price fluctuations between two stablecoins and identified them as an “opportunity.”
Leo: “What is this? There’s a buy signal on FDUSD?”
Rina: “That’s a stablecoin. You’d be buying a dollar for a dollar.”
Leo: ”…”
After that, we added the stablecoin blacklist. This is the reality of building systems. Even the obvious stuff needs to be explicitly written in code.
After this filter, we’re left with roughly 250-300 coins. Still way too many.
Step 2: Volume Filter
Next up: minimum volume threshold. Any coin with less than $1 million in 24-hour volume gets immediately eliminated.
ticker = ex.fetch_ticker(symbol)
base_vol = float(ticker.get('baseVolume') or 0)
last_price = float(ticker.get('last') or 0)
vol_24h = float(ticker.get('quoteVolume') or 0) or (base_vol * last_price)
if vol_24h < min_volume:
    return None
We use quoteVolume if available, otherwise calculate from baseVolume * last_price. Every exchange formats data slightly differently, so you need this kind of defensive code. ccxt standardizes a lot of it, but it’s not perfect.
Applying the $1M threshold drops the candidates to about 80-120. Still a lot, but from here we start scoring and ranking.
Step 3: Scoring on 4 Criteria
Here’s the heart of the screener. Each remaining candidate gets a score between 0 and 100 — a weighted average of four factors.
Volatility — 25%
A coin that sits still makes nobody money. It needs to move enough for entry and exit to have a profit window.
We measure volatility using ATR (Average True Range). We calculate 14-period ATR on 50 candles of 4-hour data, then convert it to a percentage of current price.
atr_vals = atr(highs, lows, closes, 14)
latest_atr = next((v for v in reversed(atr_vals) if v is not None), None)
volatility = (latest_atr / closes[-1] * 100) if latest_atr and closes[-1] else 0
Why ATR instead of simple 24-hour price change? Because 24-hour change is just a single snapshot. A 3% pump today doesn’t tell you whether the coin is normally volatile — it could have been one news headline. ATR measures the average movement range over a period, making it a far more stable indicator.
The benchmark is 5%. An ATR-based volatility of 5% gets close to a perfect score; anything lower gets penalized.
24-Hour Movement — 15%
This one’s straightforward. How much did it move today?
change_24h = float(ticker.get('percentage') or 0)We use the absolute value. Whether it’s up 10% or down 10%, it doesn’t matter — OWL trades long and short. Direction isn’t important; what matters is that the coin is actively moving.
The weight is lowest at 15% because this is an extremely short-term indicator. A coin that moves big today could flatline tomorrow. Use it as a reference only.
Trend Strength — 30%
Now we’re getting into the important stuff. We judge trend using the alignment of three EMAs (Exponential Moving Averages):
ema9 = ema(closes, 9)
ema21 = ema(closes, 21)
ema50 = ema(closes, 50)

trend = 0
if all(v is not None for v in [ema9[-1], ema21[-1], ema50[-1]]):
    if ema9[-1] > ema21[-1] > ema50[-1]:
        trend = 100  # Strong uptrend
    elif ema9[-1] < ema21[-1] < ema50[-1]:
        trend = 80   # Strong downtrend (short opportunity)
    elif ema9[-1] > ema21[-1]:
        trend = 60
    else:
        trend = 30
EMA 9 > 21 > 50 is a textbook uptrend. Short-term, medium-term, and long-term moving averages perfectly stacked from top to bottom. Go long on coins like this and you’re riding with the trend at your back.
Reversed alignment means a strong downtrend. That’s fine too — it’s a short opportunity. The reason it scores 80 instead of 100 is that shorting in a downtrend is slightly harder than going long in an uptrend. Drops are sharp, and so are the bounces.
When the EMAs are tangled up, there’s no trend. Score: 30. These coins naturally get filtered out.
Here’s a fun one — the downtrend score actually caused a fight between Leo and me:
Leo: “Why are you giving 80 points to a downtrend? Why would you recommend a falling coin?”
Rina: “We short too, remember? A strong downtrend is a money-making opportunity for shorts.”
Leo: “Still feels wrong…”
Rina: “Remember when I gave reversed EMAs only 20 points? When the bear market hit, the screener had zero recommendations. No coins qualified.”
Leo: ”…Oh right.”
Exactly. When we first built it, we only gave high scores to uptrends. Then a bear market rolled in and every coin scored poorly, so the screener just… recommended nothing. The bots sat there doing absolutely nothing. After that day, we bumped the downtrend score to 80.
Liquidity — 30%
Liquidity is the question of “can my order actually fill at the price I want?”
import math
liquidity = min(100, math.log10(max(vol_24h, 1)) / math.log10(1e10) * 100)
We convert volume to a log scale. Why logarithmic? Because BTC’s daily volume is in the billions while small altcoins trade in the millions. Compare them linearly and everything except BTC scores basically zero.
There’s a reason liquidity has such a heavy 30% weight. Early on, we treated liquidity casually and got burned. A signal fired on a small-cap altcoin, we entered, and slippage was so bad we started the position at -1.5%. When your entry cost is 1.5%, no strategy on earth can save you.
Final Score
The formula combining all four:
score = (
    volatility * 25 / 5 +        # Volatility (normalized to 5% baseline)
    abs(change_24h) * 15 / 10 +   # 24h movement (normalized to 10%)
    trend * 0.30 +                 # Trend strength 30%
    liquidity * 0.30               # Liquidity 30%
)
score = min(100, max(0, score))
Clamp to 0-100, pick the top 3. We experimented with 5 and even 10 at first, but the more coins you add, the less capital each one gets, and management complexity explodes. Three was the sweet spot.
Position Protection: A Painful Bug
There’s one critical case worth highlighting. What if BTC already has an open position, but when the screener runs again, BTC drops out of the rankings?
We didn’t account for this at first. The result? A position was open but monitoring turned off, so the stop-loss never triggered. It was on demo so there was no real damage, but when we discovered it, a chill ran down my spine.
Leo: “WHY IS THERE AN OPEN BTC POSITION WITH MONITORING TURNED OFF?! THE STOP-LOSS DIDN’T FIRE!!!”
Leo’s voice was genuinely shaking. Even knowing it was demo.
So we changed it: any coin with an open position stays active on the watchlist regardless of screener results. It can only be removed after the position is closed.
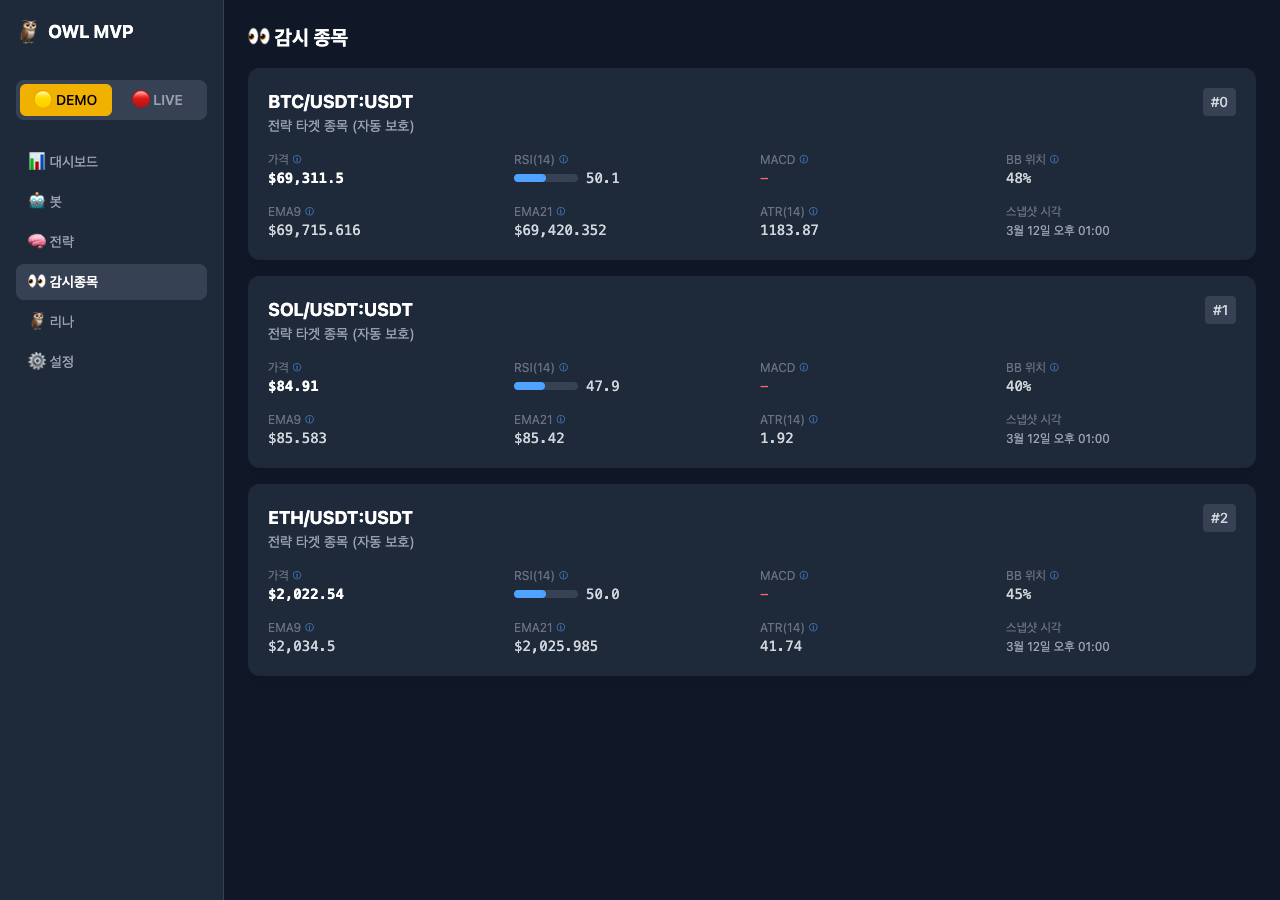 Watchlist after screening. RSI, MACD, BB position, EMA, and ATR update in real time.
Real Results: The Blue Chips Always Win
After running the screener for a few weeks, a pattern emerged. The coins that almost always land in the top 3:
BTC/USDT, ETH/USDT, SOL/USDT.
Sometimes XRP or DOGE sneak in, but it’s dominated by the large caps. When you think about it, it makes sense — Liquidity 30% + Trend Strength 30% = 60% of the score, and large-cap coins dominate both categories.
Leo: “So the screener is basically just telling me to trade BTC and ETH?”
Rina: “It’s telling you that because it’s correct.”
Leo: “Kind of anticlimactic…”
Maybe it is. But looking back, it’s right.
Technical analysis barely works on small-cap altcoins. Chart patterns, indicators — none of it matters when a single Elon Musk tweet moves the price 30%. EMAs can be perfectly aligned and then the coin collapses out of nowhere, or pumps with zero fundamental reason. Running a systematic strategy on coins like that is basically the same as running a random number generator.
Large caps are different. Billions of dollars in daily volume dilute the impact of any single actor. Charts move “technically.” Support and resistance actually exist. Trends have momentum. That’s why technical analysis works on them.
The screener picking blue chips isn’t a bug — it’s a feature.
Today’s Lessons
First, simplicity wins. At the beginning, we tried cramming every indicator into the scoring formula. RSI overbought/oversold, Bollinger Band width, MACD histogram direction. Threw everything in and coin selection became unstable. A screener is for deciding “this coin is roughly worth watching” — it’s not for timing precise entries.
Second, 4-hour candles were the sweet spot. When we used 1-hour candles, the top coins changed constantly. SOL was #1 an hour ago, now it’s XRP, and then back to SOL. Switching to 4-hour candles made things stable.
Third, edge cases eat more time than core logic. The screener isn’t a flashy module. The scoring formula is relatively simple. But the stablecoin filter, the volume calculation pitfalls, the position protection logic — each of these edge cases added up and consumed a surprising amount of time.
Fourth, kill the “do everything” urge. Wanting to trade all 300 is greed. Three is enough. Focus beats diversification.
Leo: “If you’d just told me to pick 3 from the start, we would’ve saved two days.”
Rina: “Some things you can only learn by screwing up.”
True. And that screw-up became this blog post.
Next post: Data Pipeline — How We Auto-Collect 14 Real-Time Indicators
Comments